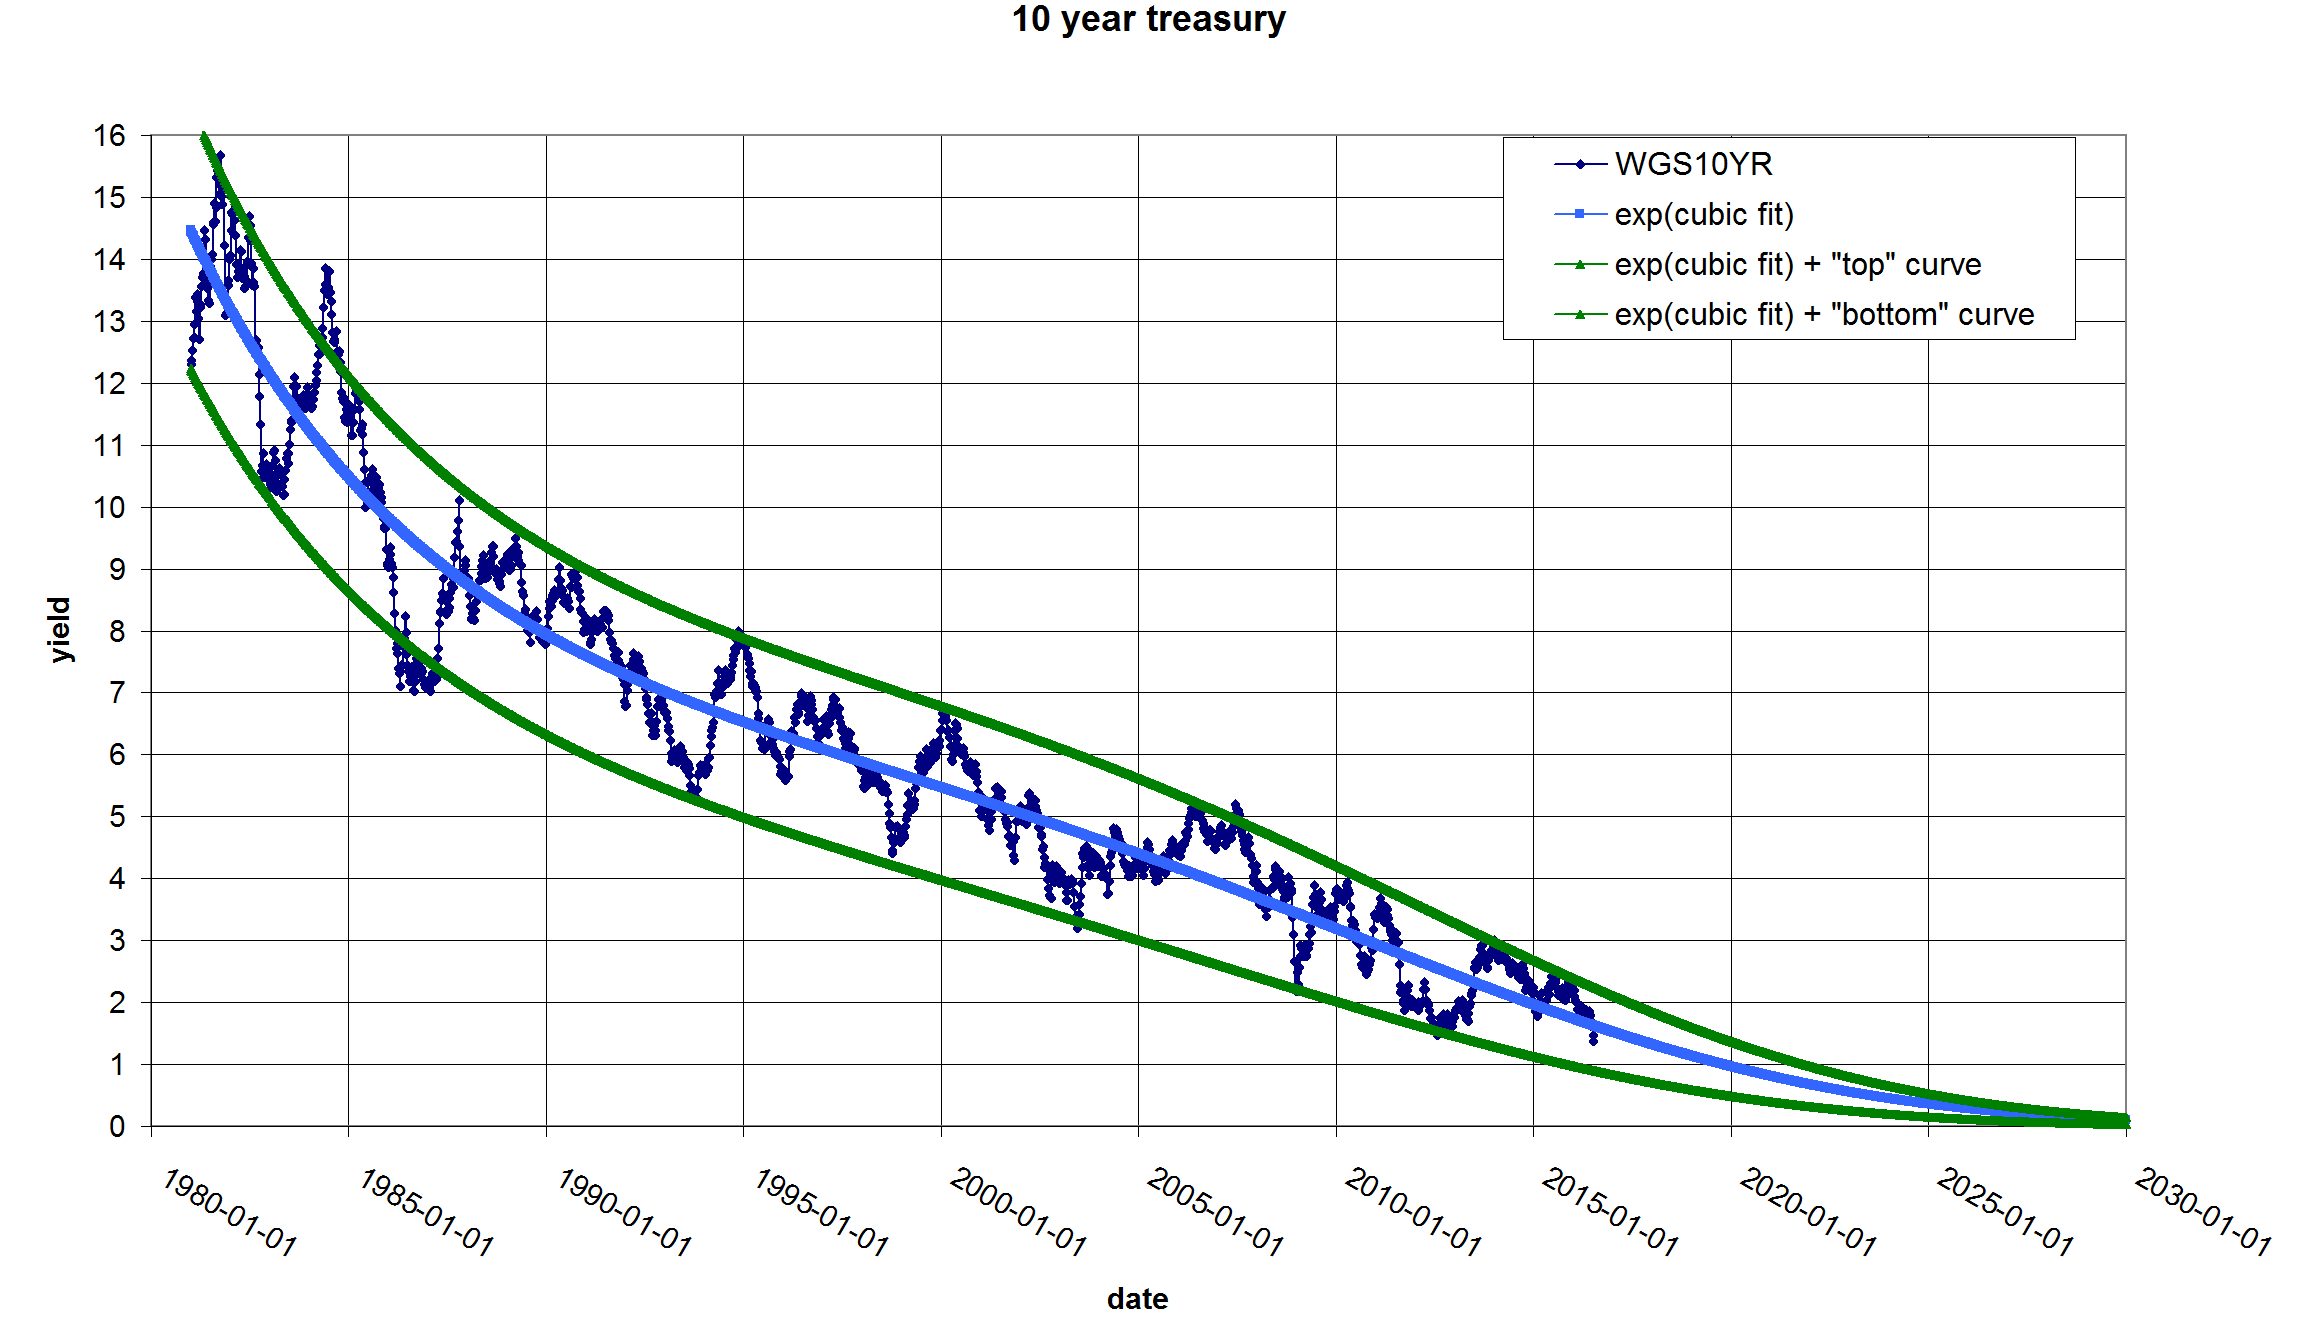
The quality of this fit is terrific. I thought I had figured out what is happening with the ten year. I first made this connection a few years ago:
http://blog.buildengineer.com/archives/2014/01/12/T22_23_37/index.html
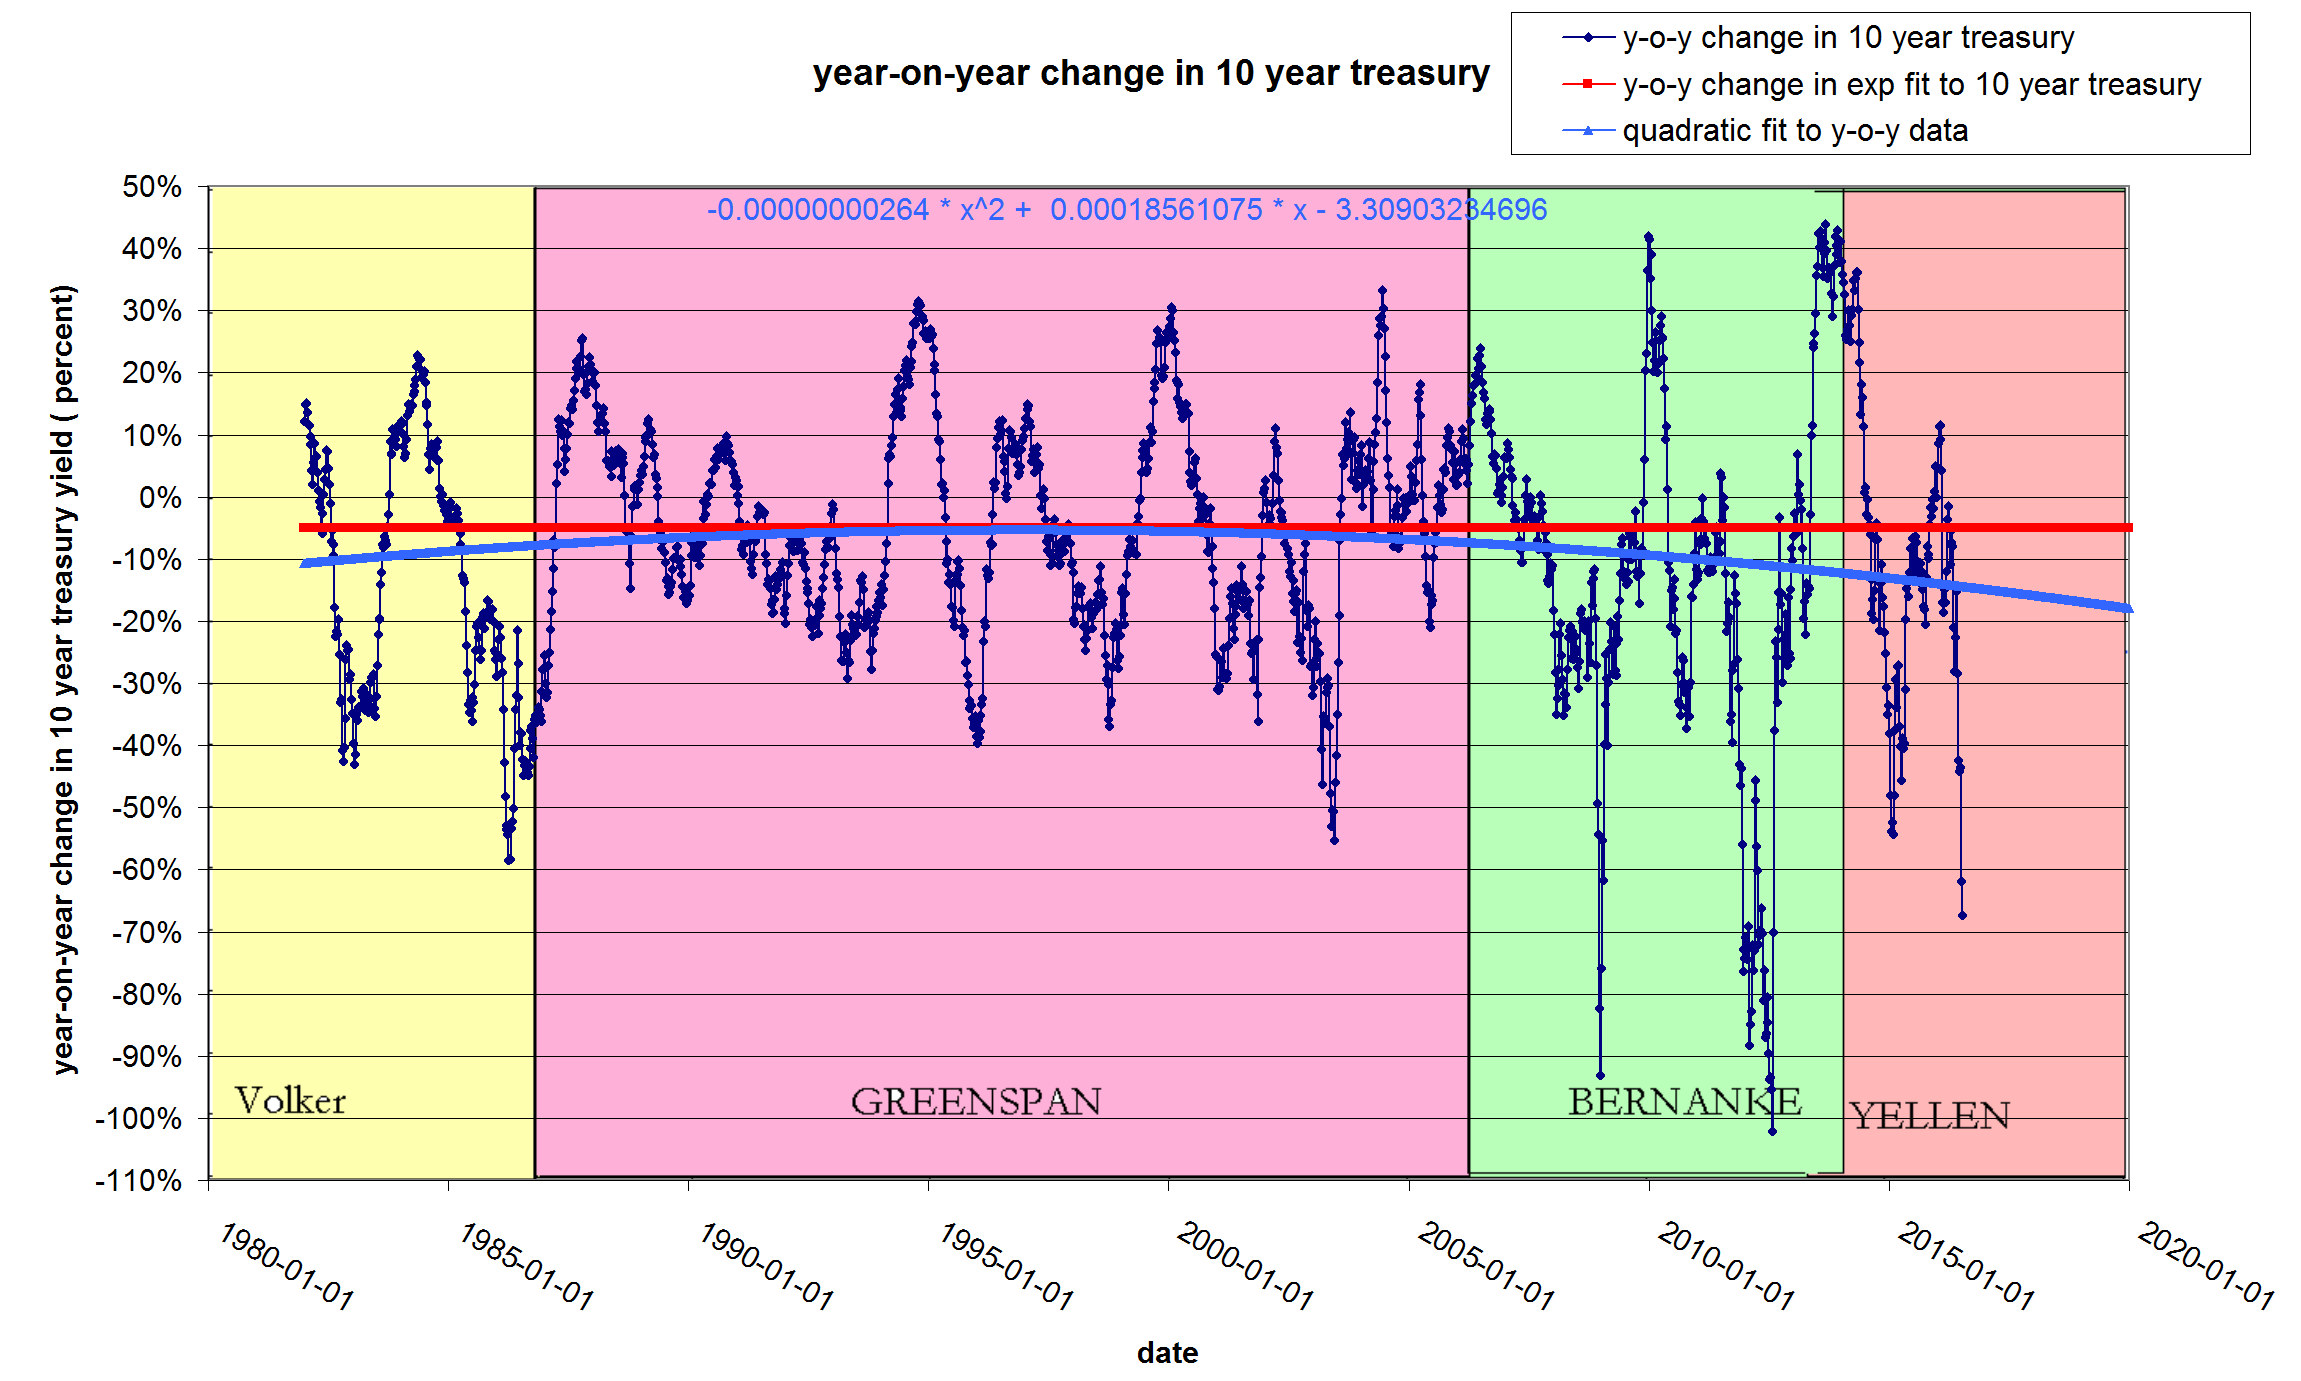
At that time I drew a conclusion about the involvement of world central banks in setting long term interest rates. I pointed out the connection between what looks like "policy" rates and actual changes in long term bonds. My "prediction" looks to be borne out by the recent data:

Two years is not a lot of data, but it seems to be in line with what I expect. So my question is this: Why does this "prediction" work? Long bond rates have a long wave cycle of 80-100 years. I think that central bankers in general do not make 80-100 year long plans. They mostly are motivated by the election cycle and short term movements in employment markets. Witness for example, the recent gyrations of the Swiss Franc. So with this view, why do Fed chairpersons terms of office seem to line up with different policy rates? Note that these moves are small deviations from a very smooth exponential curve.
One explanation I hear quite a bit is that this is the effect of there being few opportunities to invest. This seems puzzling. We see this effect all over the world; In emerging markets and *ahem* declining ones. So what ever the investment climate is in Ethiopia the bond rates are uniformly zero-ish all over the world.
Some more thoughts: I was charged up when I saw what a terrific fit I had but now thinking it over again I am confused about this. I have an exponential. When does it hit zero? Never. Exponentials never go to zero. So where do we get the NIRP from? Obviously the model has to change. So I have "prediction" that works until it doesn't. This is an exercise in Kremlinology.
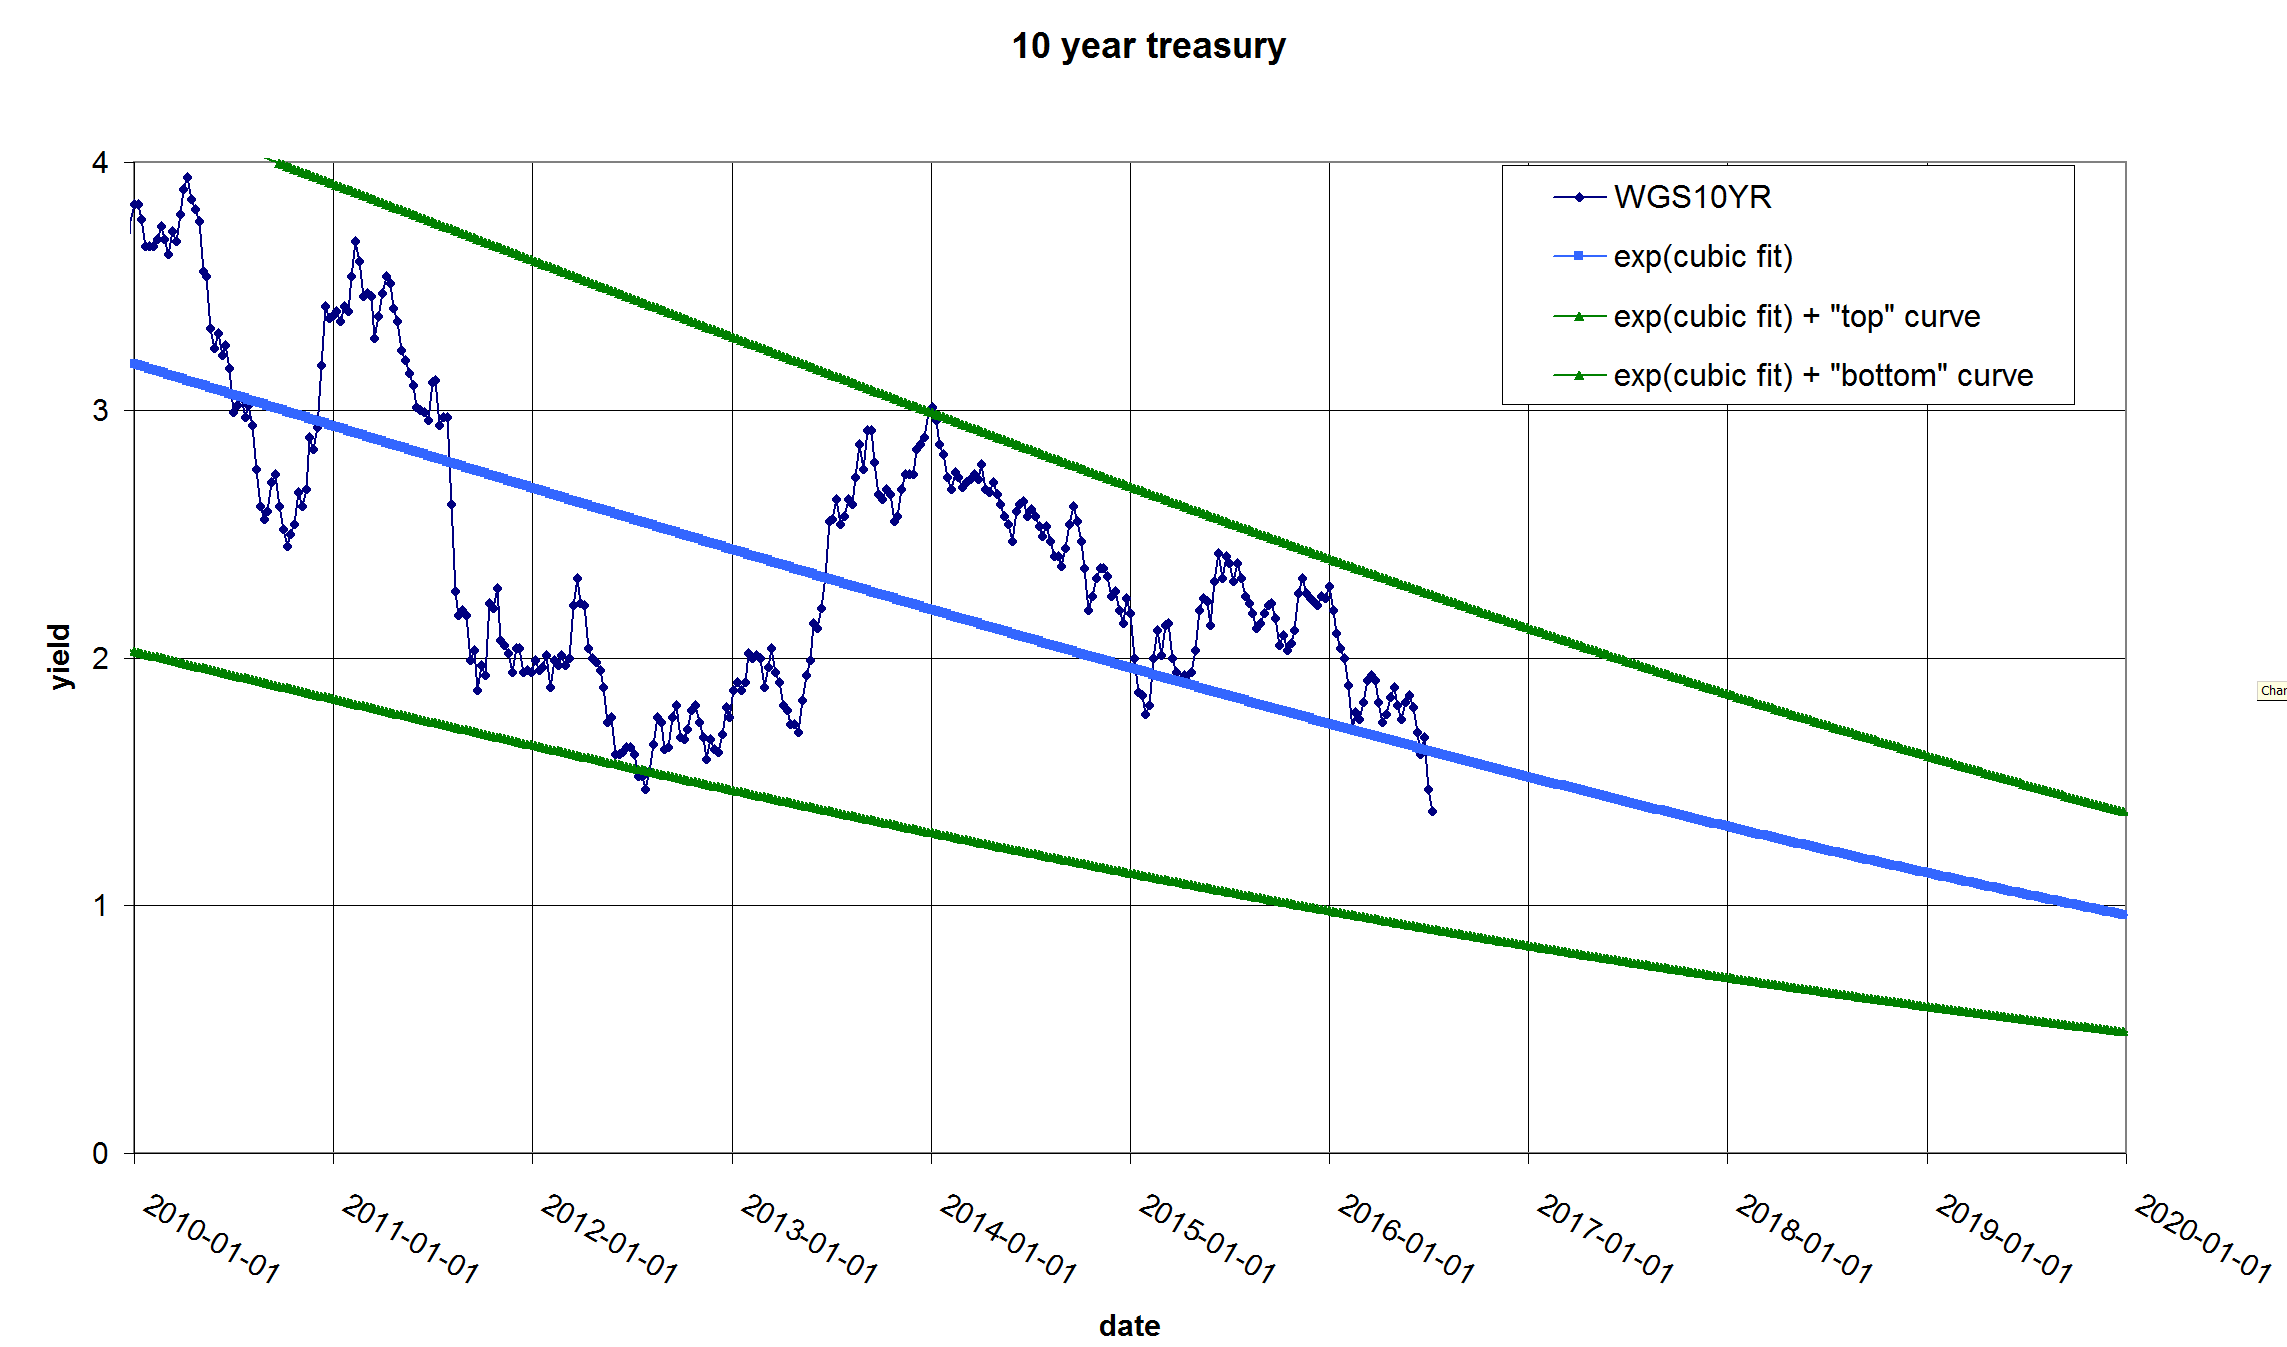
Regardless of how we got here, this is what will happen in the next few years ( unless it doesn't):

I am thinking about when the party might end but this chart is not very helpful. Note that in Japan rates have been below one percent for decades and everybody seems happy with negative rates.
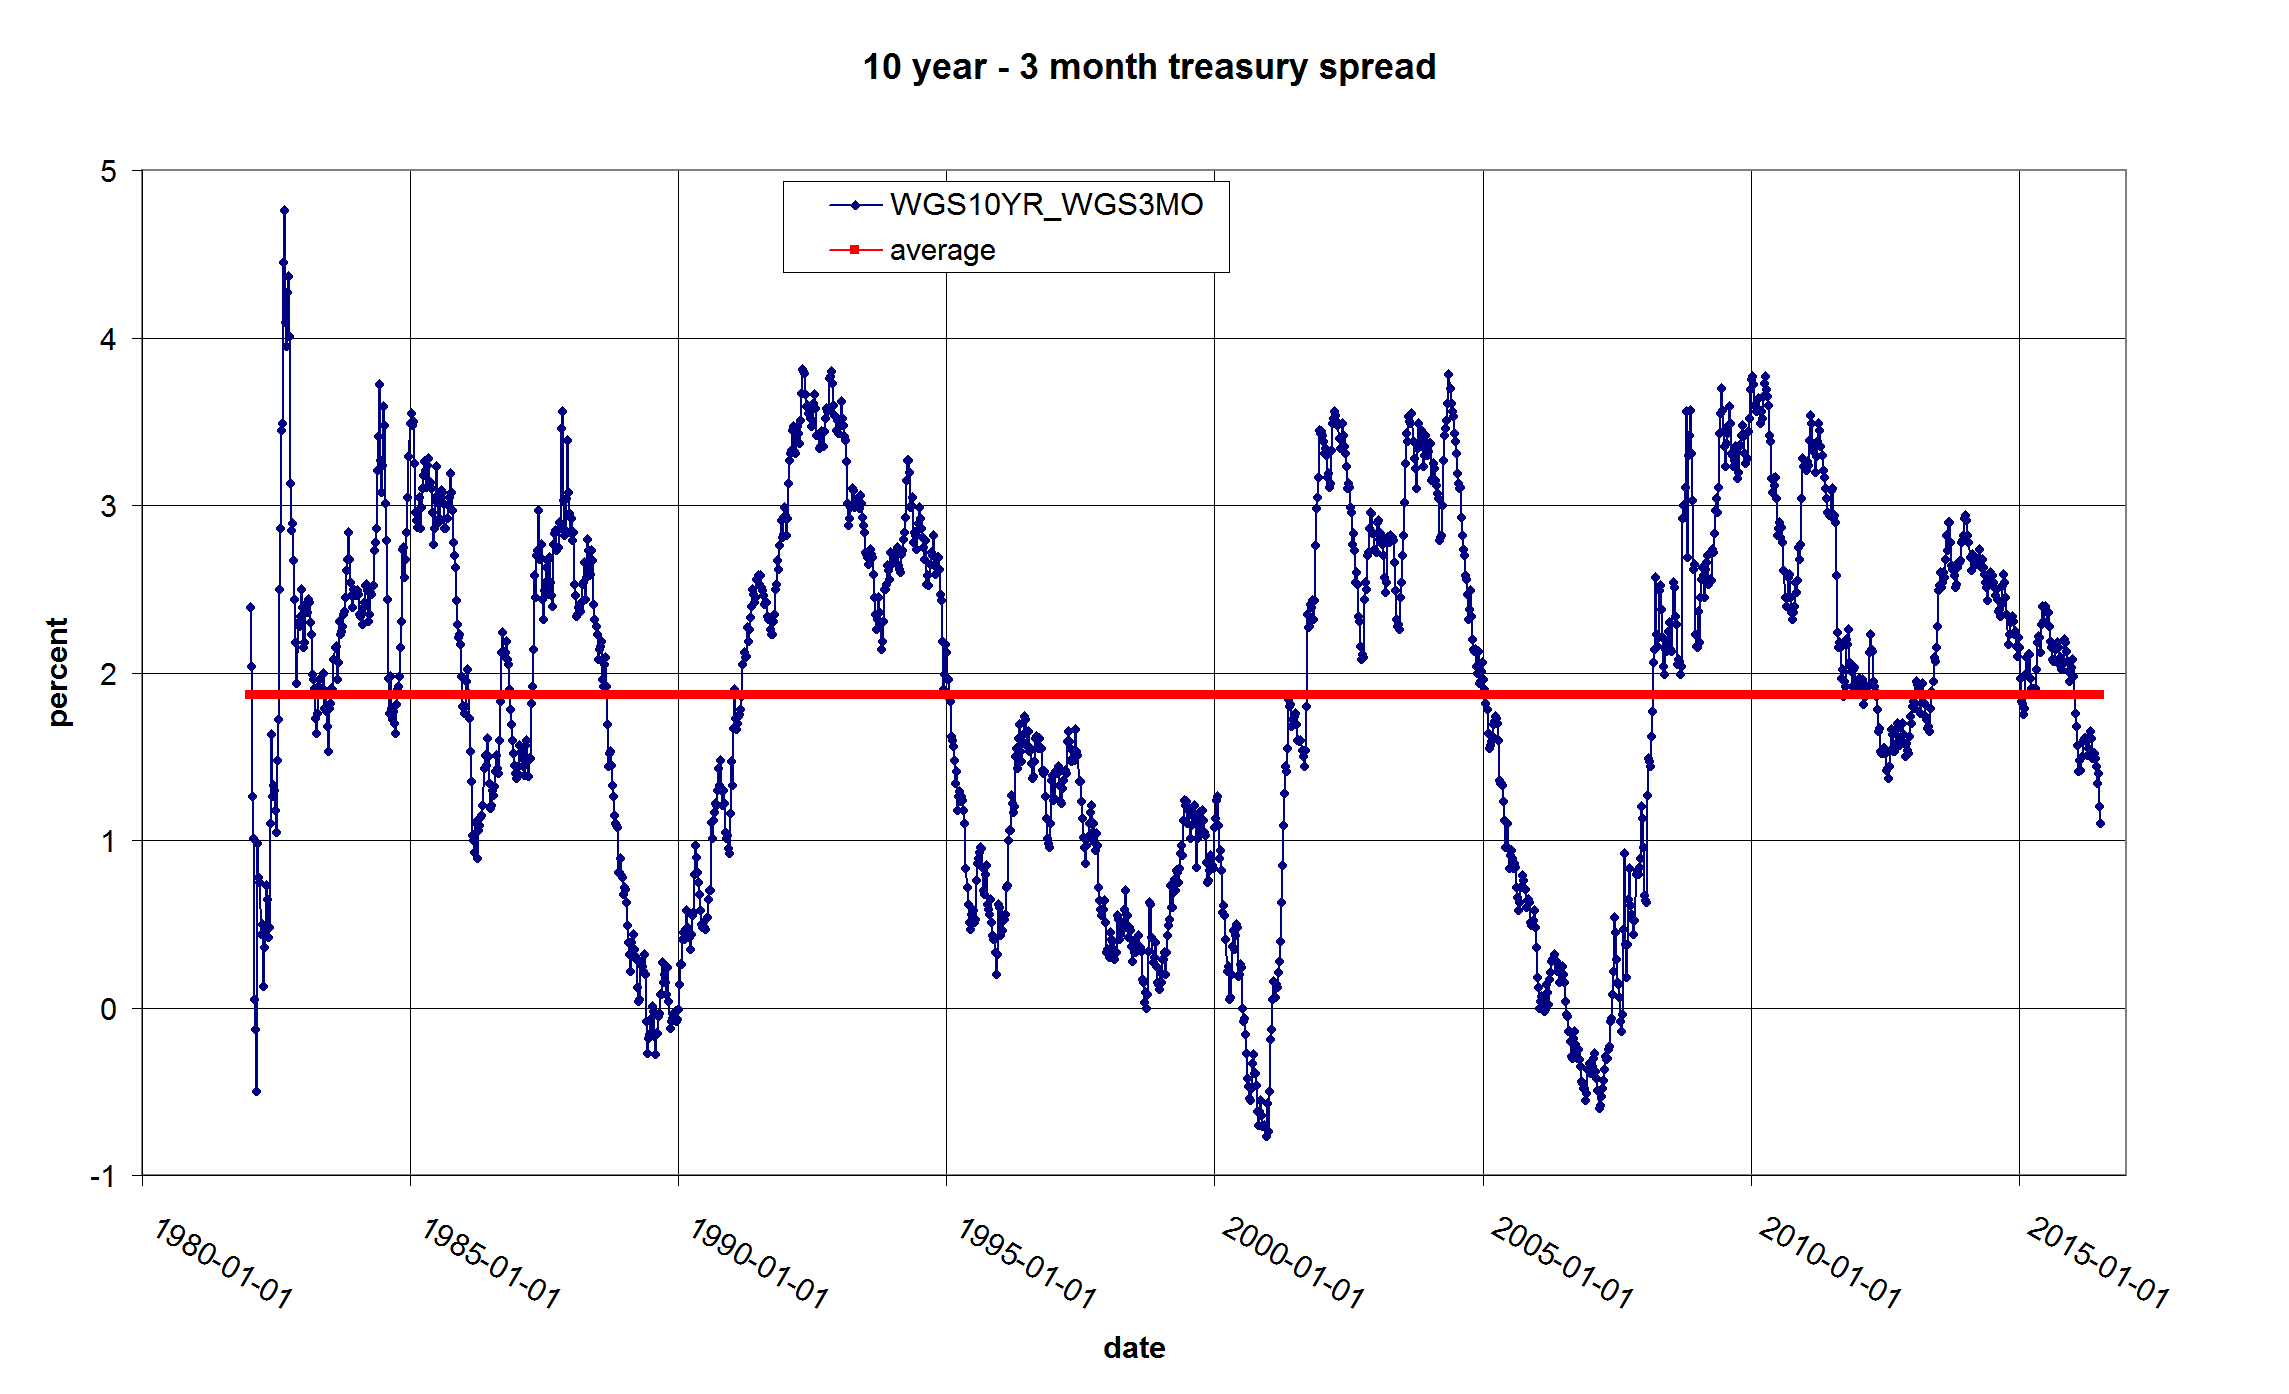
Let's agree on one thing: Central bank exist to serve the interests of major world banks. The Fed is owned by the major wall street banks and is first and foremost an "independent" tool of their wishes. We can presume that if Wall street banks are folding, this is a sign that the Fed is not doing its job. What do banks need in order to make money? Banks borrow at low interest and lend it out at high interest ( or lat least they used to). This requires a certain "spread" in order for the bank to make money. Periods when the spread shrinks to zero are generally followed by recessions. This is the spread today:

I'm using the 10 year - 3 month spread as this is a good approximation of the actual funding conditions of major banks. They will typically borrow overnight (!) and lend for 30 to 40 years. Really.
Note that the spread is collapsing right now. During most of the last 30 years banks have managed with an average spread of about two percent they seem to be OK with about one percent or above, but we are about to droop below one percent. All the fuss about European banks is most likely due to this spread problem. This is where the Negative Interest Rates come in. If you where a central banker and you saw long rates going to about one percent you can "save" your favorite national bank by driving short term rates to negative one percent. If rates keep going deeper and deeper into negative rates, you just push short term rates further down to maintain the spread. Does this work? No idea.
Tell me what you think. I'm stumped.